Visualization examples from my some research and from fun side projects.
Superior Science Advocacy Group – Network

SSAG-N (vBeta 0.1) is an interactive, visual representation of the people and institutions dedicated to expanding human knowledge and experience in the Twin Ports region of Duluth, MN and Superior, WI. SSAG-N is currently under construction and features only those who have given talks through Cafe Scientifique Twin Ports, but myself and other science advocates in the area have plans for its expansion.
Percolation in random Menger sponges
Percolation in porous media can be studied by generating complicated pore space arrangements using classic fractal models, such as the Menger sponge.
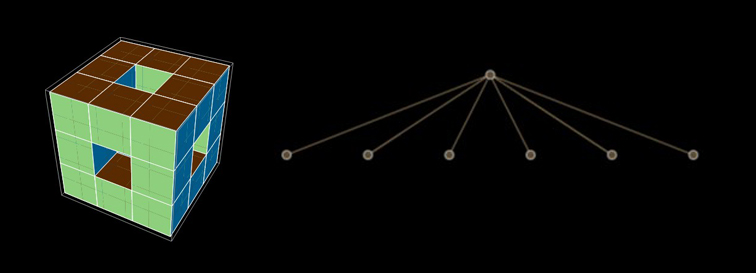
Menger sponge – Iteration 1 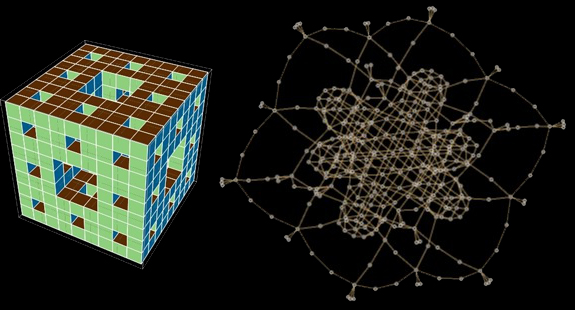
Menger sponge – Iteration 2 
Random Menger sponge – Iteration 2 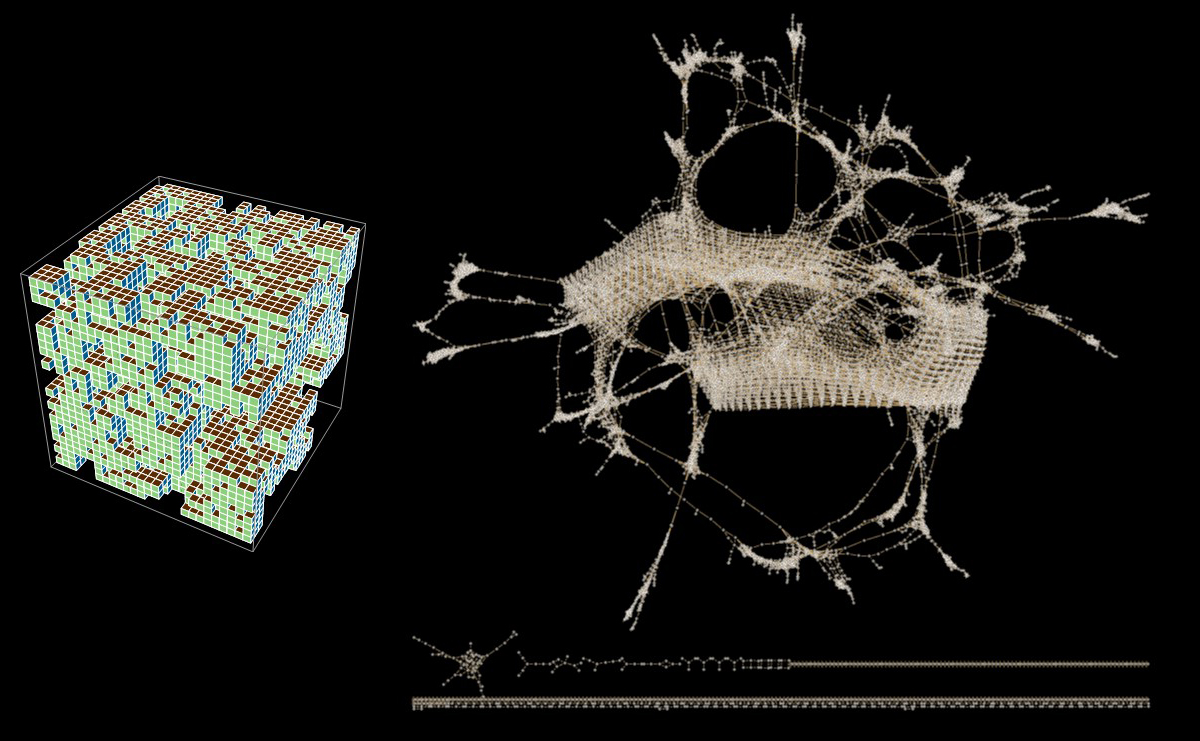
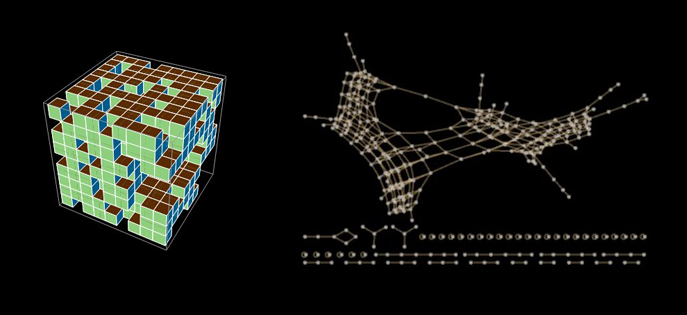
Random Menger sponge – Iteration 3
Adverse Outcome Pathway (AOP) Networks
Adverse outcome pathways organize toxicological knowledge from initiating events at the molecular scale through a cascade of reactions to an adverse outcome, often at the scale of an individual or a population. These networks are stored in an online database. I analyzed that database. Here is the slide deck from a presentation I gave on the topic.
If you’d like to hear me speak on the topic, my presentation was recorded and can be found here
Optimal groups to add connectivity to an organization, aka Operation Bacon (Kevin Bacon)
Let’s say you are in charge of an organization and have the opportunity to use a small group exercise to build connections. This research looked at how one might choose groups and analyzed resulting connectivity.

Groups with members added who are maximally distant, “Gregarious grouping”. 
Groups with members added who are minimally distant, “Shy grouping”. 
Alternate visualization, force directed layout updating as groups are added, “Gregarious grouping”.
